“Verbruggen did a lot for the sport, to develop the sport but his decisions were – and this is between you and me – any decisions he made in a certain period to do with doping and so forth… It certainly wasn’t that he was pro-doping or encouraging doping, but he would always protect the sport,If he had to take a decision on something and he could see that the sport would be damaged because of that decision then he wouldn’t take the decision. I think that his was sort of his philosophy: ‘to protect the sport.’” Pat McQuaid to Antione Vayer – March 2013
In 2010, Cycling conducted 21,427 anti-doping controls with 254 adverse samples, only Football (30,398) and Athletics (25,013) conducted more anti-doping controls. ![]() In 2009 the results were similar. 21,835 samples collected, 318 positives, with again, only Football and Athletics doing more testing, which – when you bear in mind the sheer numbers of sportsmen involved in those two sports – really puts Cycling at the forefront of anti-doping.
In 2009 the results were similar. 21,835 samples collected, 318 positives, with again, only Football and Athletics doing more testing, which – when you bear in mind the sheer numbers of sportsmen involved in those two sports – really puts Cycling at the forefront of anti-doping.
![]()
The pattern was repeated in 2008, and again, only Football and Athletics tested their athletes more. The results are telling – each year Cycling tests its athletes more than virtually every other sport, and every year the number of adverse samples goes down. ![]() Cycling is at the forefront of anti-doping, and with every passing year gets cleaner. Each year the UCI can tell us how much they are testing, and how the number of positives is going down. It reads well. Cycling leads the way, or does it? On the surface it’s an easy argument to accept. Each year we test more and more, each year the number of positives go down, with the conclusion being the UCI are doing a great job. But in 2012, the way WADA reports the figures changed. In previous years we were simply presented with total tests and adverse results; from this year onward we now have detailed figures – by testing agency, by product, by lab – and it can give us a whole different perspective. We can ask the question again, is the UCI really at the forefront of anti-doping, or is it just making sure the figures look as good as possible? In 2012 things continued to improve, 20,624 samples tested, 270 adverse findings, we continue to lead the way, and positive tests continue to drop.
Cycling is at the forefront of anti-doping, and with every passing year gets cleaner. Each year the UCI can tell us how much they are testing, and how the number of positives is going down. It reads well. Cycling leads the way, or does it? On the surface it’s an easy argument to accept. Each year we test more and more, each year the number of positives go down, with the conclusion being the UCI are doing a great job. But in 2012, the way WADA reports the figures changed. In previous years we were simply presented with total tests and adverse results; from this year onward we now have detailed figures – by testing agency, by product, by lab – and it can give us a whole different perspective. We can ask the question again, is the UCI really at the forefront of anti-doping, or is it just making sure the figures look as good as possible? In 2012 things continued to improve, 20,624 samples tested, 270 adverse findings, we continue to lead the way, and positive tests continue to drop.
![]()
More importantly, cycling continues to lead the way in number of tests conducted on its athletes. 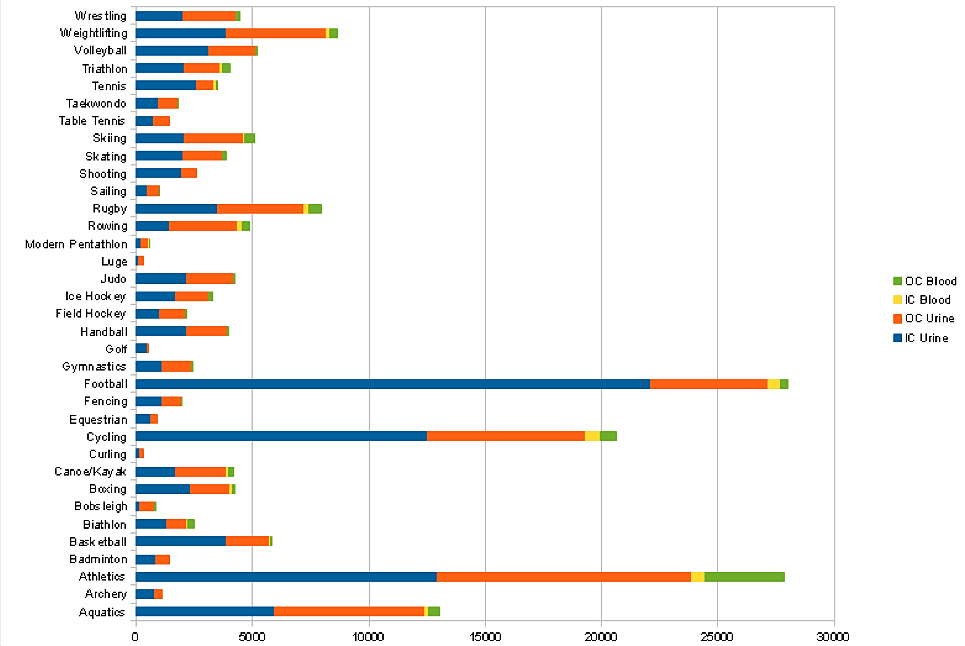
Note: Blood tests don’t include those for BioPassport samples
Again, as in previous years, only Athletics and Football rival Cycling for the numbers of tests, and if that was the end of the story it would make great reading. But that’s not really the end of the story. On August 2 of this year, Travis Tygart spoke to Shane Stokes of Velonation.
“We are going to have the USA Pro Cycling Challenge happen here in a couple of weeks. It’s one of the biggest races in the United States, and absolutely the biggest race in Colorado. Yet the independent agency based in Colorado [USADA] – which runs the programme for the Olympic movement which is also based in Colorado – is not doing the testing, because the UCI refuses to give up the control. We are confident, just like in seasons past, there won’t be CIR testing, there won’t be human growth hormone testing, there won’t be EPO testing. It is a charade…”
The UCI has done its very best to monopolise testing within the sport. Nearly half of all testing conducted in cycling is conducted by the governing body – the UCI – the same body responsible for the promotion and management of the sport. A clear conflict of interests? Many think so, and Brian Cookson has made it a focus of his campaign for leadership of the UCI that testing should be moved out of the UCI’s hands and to those of an independent body. Cycling is not alone in this. Tennis, a sport widely critisised recently for its poor testing, sees the bulk of its anti-doping overseen by its own governing body, the ITF. Why is this crucial? Because if the governing body can control the bulk of the sampling, they in turn can also have a greater bearing on the results, its simple numbers management, and like schools that target the areas that bring them success in the eyes of the public, the UCI can control the numbers to make them look as good as possible in the eyes of the public, without really being an effective anti-doping program.
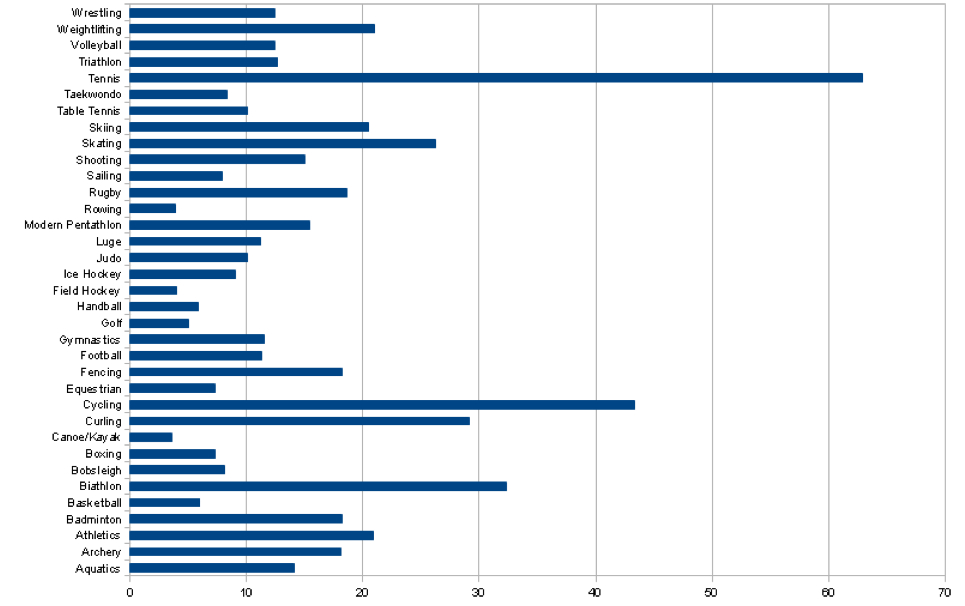
Percentage of controls carried out by sports governing bodies
So how do the UCI manage these figures? Lets look at one example – EPO testing in urine. In 2012, as a sport we collected more than 19,000 urine controls. 13,000 in competition, and 6,000 out of competition. A huge number. The sad fact though is of those 19,000 samples collected, 7,000 were actually tested for EPO, around 30% of all samples. A number of factors affect this, not least of which are the budgetary constraints placed on the governing body, the national anti-doping agencies, and the race organisers. So what do we test? In 2012 as a result of in-competition testing there were 244 adverse samples for EPO, with just 24 samples out-of-competition positive. Is this purely because we take considerably more samples in-competition? No. Because despite taking twice as many samples in-competition as out-of-competition, we, as a sport only actually analysed 3000 in-competition samples for EPO in 2012, compared with the analysis of more than 4000 samples out-of-competition. If we look at it as a percentage, the percentage of in-competition samples testing positive for EPO is 7 times higher than for out-of-competition. 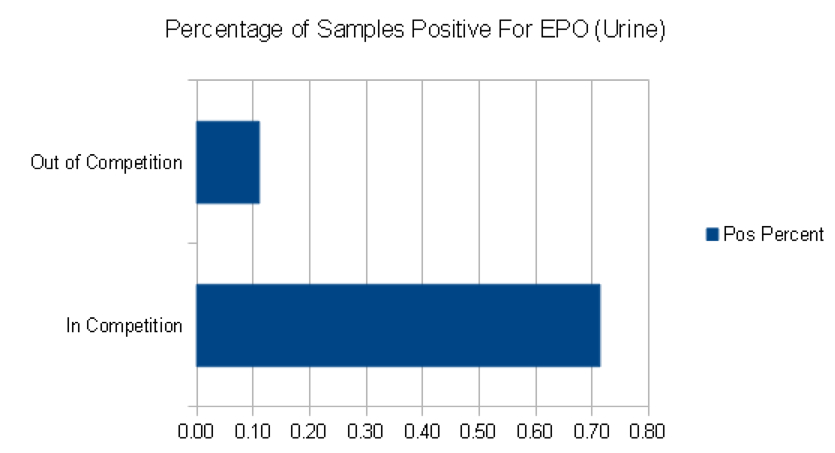 This figure is repeated across all sports, not to such a great degree, but still, in-competition testing provides a much higher rate of adverse per tested, versus out-of-competition testing.
 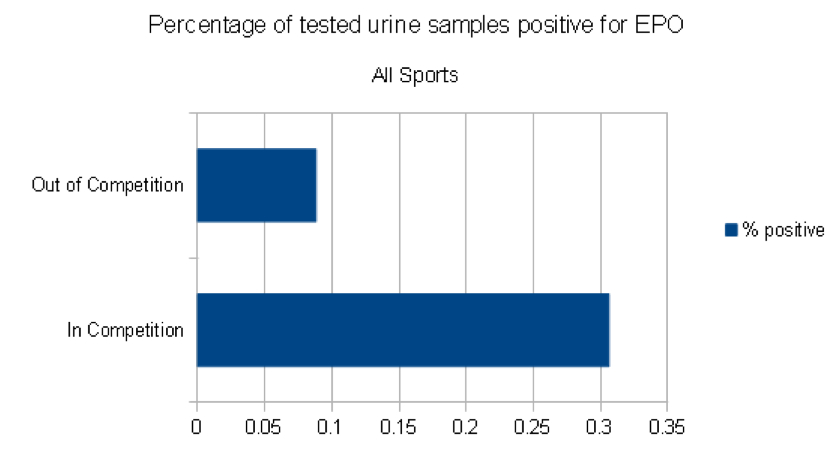 Why is the positive rate so much lower in out-of-competition tests? It could be that riders simply aren’t using EPO to a great extent out of competition. It could be the sheer number of out-of-competition tests is dissuading riders from using EPO (the line the UCI would no doubt like us to believe), but it could also be that EPO testing out of competition is simply a failed exercise. In his recent book, Tyler Hamilton explained just how easy it was to evade a positive test for EPO, and in many ways the ADAMS (whereabouts system) assists this. Out of competition tests occur between 7am and 11pm, but within that you can specify a one-hour timeframe when you will be in an exact place at an exact time. If your specified window is 9am to 10am you know that your risk in microdosing EPO at 11pm is minimal. With a half life of around 6-8 hours when injected directly into the veins, it’s really not that difficult to be clean when you are tested at 9am. In competition it becomes more risky. Maybe if you are doping without your team’s knowledge you have to do it later at night when other riders are asleep. Your chance of being tested at 7am is greatly increased, overall the risk is higher.
 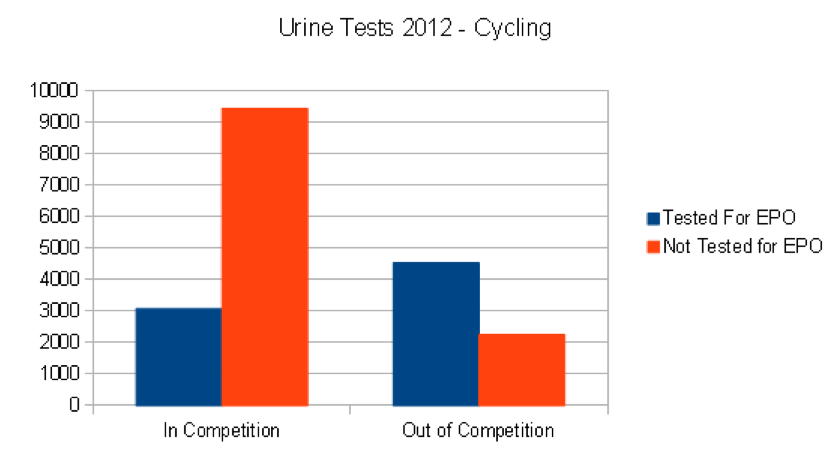 Knowing this, and knowing that the testing for EPO in-competition provides more positive results than out-of-competition, the expectation would be that of the 13,000 samples collected in competition, a vast majority would be tested for EPO. Out of competition, with its low EPO detection rate, you would expect the percentage of samples tested to be lower, for out-of-competition testing to be focussed on collecting blood data for the biological passport. So why does this not happen? As a sport we test considerably more samples for EPO out of competition, despite the lesser number of samples being taken.
 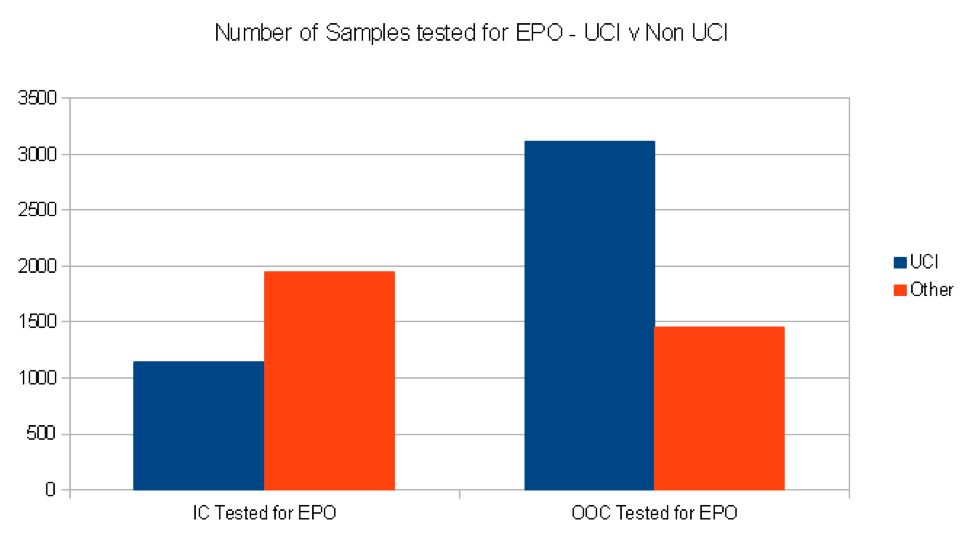 In tests conducted by National Anti Doping agencies, by race organisers, this is true. Granted, the bulk of samples collected by NAD’s are in-competition, but when it comes to actual analysis, the NADs focus their analysing on the in-competition samples, and they get results. Nearly 100 of the 250 positives come from National Anti-Doping agencies. The UCI, by contrast, test very few of their in-competition samples. The UCI analyse nearly all of the out-of-competition samples they collect for EPO, yet they only analyse around 20% of the samples they collect in-competition for EPO. When we compare the UCI percentages against national anti doping agencies, it becomes clear – the UCI heavily focus their analysis on out-of-competition samples, contrary to other sports.
 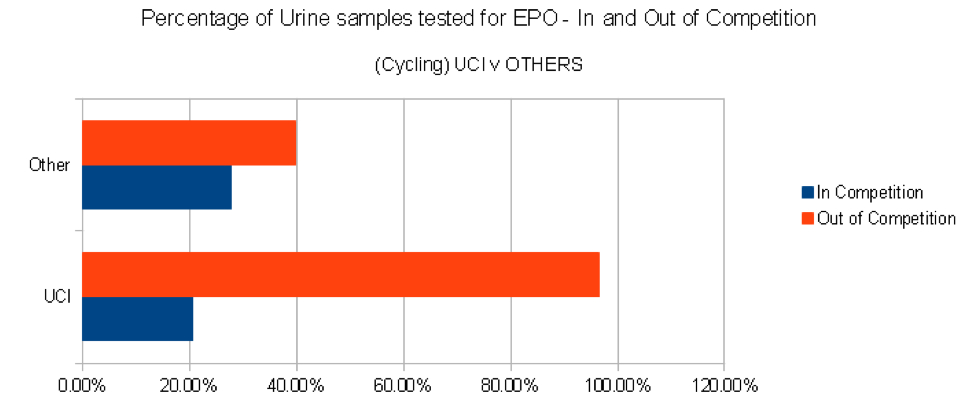 So what does this mean and what questions does it raise? Does the UCI focus on analysing urine samples out of competition for EPO for a reason? The suggestion would be yes. One group provides a high rate of positive, one group has a low rate of positive. Test the group with the low rate, it keeps your testing figures as high as possible, while keeping the number of positives as low as possible. Mathematically, if the analysis of the out-of-competition samples was switched to analysing in-competition samples, we would see an extra 66 adverse samples in 2012 based on the .7% detection rate. Of course that is just mathematics, and it’s unlikely that percentage would be exactly replicated, but there is a strong argument that it would be at least partially replicated. Which brings us back to the original numbers – the UCI are responsible for nearly 50% of the testing within the sport. By exercising this level of control, they are able to reinforce the statistics to their benefit. Are the UCI fiddling the figures? Are they making sure they test the group that produces the lowest rate of positive? Are we really leading the way in anti-doping? When discussing Verbruggen back in March Pat McQuaid said:
“I don’t fully back that, but then again maybe I’m wrong…”
Have things changed?


1 Comment
[…] (UCI). Och antidopingorganisationen kritiseras bland annat av röster från cykelsiten Cyclimas för att de hela tiden använder de minst effektiva testmetoderna och att de gör testerna vid fel […]